
Actually, the market reacts to two inputs for inflation: the economic numbers themselves, primarily CPI and PPI, and also the Fed’s actions, either reactive or proactive, to the inflation metrics.
Current Market Drivers
- The US labor market is tight and supply chains stay stressed.
- The Russian-Ukraine war exasperates commodity pricing.
- The financial system stressed from sanctions against Russia.
- US inflation setting records. March CPI over 8%; PPI over 11%
- The Fed under pressure: QE has turned to QT.
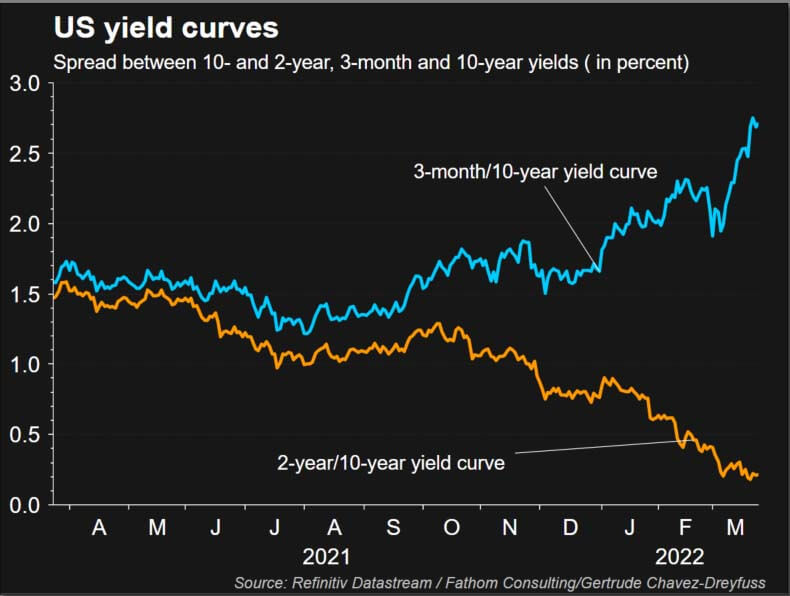
The inverted yield curve persists with the different debt markets responding in an asynchronous fashion. Results: volatility. But to shine a clarifying light on the matter, not all yield curves are the same (See graph).
The spread between the yield on 3-month Treasury bills and 10-year notes this month has been widening , which can be an indicator of an economic expansion. The U.S. 2-year to 10-year curve , on the other hand, has flattened dramatically this year and is close to inverting, where the longer maturity would yield less than the shorter. Inversions are considered a harbinger of eventual recession. But the signal right now is not clear. The 3-month T-bill yield is still lower…because it doesn’t reflect rate hikes in the future. But it will rise, as the Fed hikes rates. U.S. two-year yields, on the other hand, are a really good indicator of where Federal Reserve policy is headed over the next two years, and it’s showing a much steeper path of rate hikes.
If the Fed follows through as expected we’ll see ½ point rise in Fed Funds at the May FOMC meeting, and perhaps (68% chance per the futures market) another ½ point rise in June. The market is expecting 6-8 rate hikes yet this year; those that aren’t ½ point will be ¼ point. This level of aggressiveness is unprecedented, but with Fed Funds at
¼ % and inflation at 8%, the gap to close is unprecedented, even going back to the ‘70’s. Note, however, that this won’t help fix the supply chain breaks, stop the war in Ukraine, or get OPEC to produce more oil.
In this environment, what kind of CRE loans are “best”. There are a lot of things (terms and conditions) to consider, but on top are loans with fixed rates. Adjustable would be next, and variable rates would be least favorable. Variable rates, however, should be expected to have the lowest initial rate.
Are lenders even lending? In this environment? There are still large amounts of investable capital looking for a home. In fact, the spreads between lenders borrowing rates and lending rates have improved. So yes … lenders are lending. But again, not all lenders are the same, and not all will offer the same types of loans, or with the same terms and conditions.
In our last monthly writing (Mar 29) we offered the-then debenture rate for SBA 504 loans. As a comparative at this time, the debenture rate has zoomed in less than a month. Note that the debenture rate is a reflection of the market, and not a legislated rate set by a government agency policy.
3-29-22 4-20-22
25 Year Purchase Rate: 3.92% 4.68%
25 Year Refinance Rate: 3.93% 4.69%
20 Year Purchase Rate: 3.76% 4.62%
20 Year Refinance Rate: 3.77% 4.63%
10-Year Purchase Rate*: 3.80% 3.81%
*Jan-Feb rate. (The 10-year rate is only published every two months.)
The 7(a) loan is traditionally a variable rate loan. We are in contact with one lender, however, who is offering a fixed rate at this time. Aside from the rate differential, the structure of the 7(a) and 504 loans differs substantially. Borrowers of either of these SBA loans should understand the substantial differences between them in order to use the most applicable loan for their situation. Please call for this discussion if this is you.
We work for you, not for the lender.